Using infographics is a new way to communicate ideas to your project management office (PMO) team, project managers, and wider business. Without hiring a full-time graphic designer, what are the useful tools for creating infographics for your PMO?
There are principles to designing infographics that you need to understand. Making your data accessible, telling a story, and targeting it to your audience are all important when looking at the content of your PMO’s infographics.
Looking at the creative and informative infographics out there, you my feel overwhelmed at the idea of creating your own. However, there are tools designed specifically to help you make the most of communicating the data your have.
Let’s take a look at three of the most popular infographic packages, taking into account:
- The choice of data representation options and templates
- Ease of use and learning curve
- Pricing structures
Canva
You’ve likely heard of Canva as a powerful and popular tool for creating all kinds of graphics. When it comes to infographics, there are hundreds of templates to choose from depending on the story you want to tell with your data.
It’s very easy to use with guides and prompts. With it being one of the most popular infographic creators online, there are lots of online tutorials available, too.
You have options for maps to show performance in projects across different locations, add text over your own images to represent end products across different projects, and timelines that can show progress throughout the financial year.
In terms of pricing, Canva is US$12.95 per person, per month. It’s easily expandable if you need to increase users and if you need lots of access, there are enterprise option, too.
Along with making engaging and vibrant infographics, Canva can do lots of other things. You can use it to create great-looking process maps or tracking sheet, for example.
Visme
One of the really useful options you get with Visme is to make interactive infographics. For example, you may want to present the data across your European offices and realise all the stats on one page are overwhelming. Using Visme’s tools, you can make a map where you roll over an area and additional data is displayed.
Animations and voiceovers are also useful features when you’re really committed to modernising your communication. This isn’t just a tool for your infographics, whole slideshows with interactive elements can be created to show off your creation in context.
Visme is designed for business and marketers. You don’t have to dig through birthday card or party invites to find the content that’s going to work for your PMO. You can really dive into adding data and representing information yet a simple infographic can be made within an hour or less.
It’s priced at US$29.99 per user, per month. A little more expensive than Canva, it does have a much more business focussed use. You can easily up your subscriptions so if your project managers quickly see the value, you can add accounts for them.
Venngage
Specifically for designing infographics, Venngage has a range of different ways you can represent your data for your PMO. You get vast choices of icons and images to easily drag and drop into your image and elevate a simple chart.
Manipulating your data with a range of different graph and chart options is easy. The templates on the site get updated weekly, so you can keep your content fresh. Prefer to harmonise your PMO’s infographics long-term? You can create and save your themes and plug in next month’s or quarter’s data.
A little more expensive than the other two, at U$49 per person, per month, you do get access to an ever-changing catalogue of ideas. Similar to Canva, you can use your Venngage account to produce other useful graphic content such as mind maps, proposals, and white papers.
Infographic Creator by PMMAJIK
This is an inhouse web based tool available within the PM Majik Members Area.
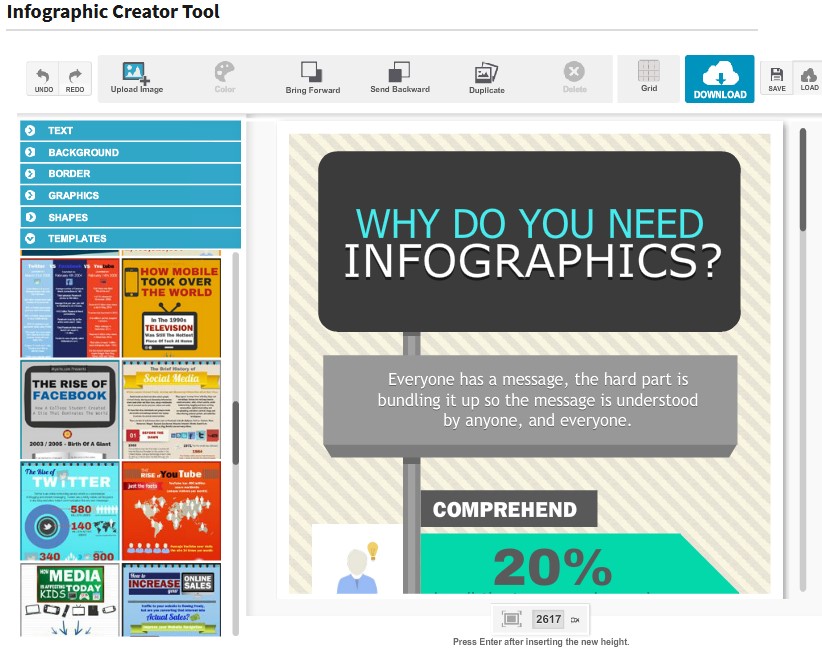
This easy to use tool allows the rapid development of Infographics for your project or PMO (in fact anything).
There are a number of menus to create headings, body text. Add images (including your own). Shapes and more.
Plus there are a number of predefined professional templates that can be used as a starting point. So all you need to do is update the text and images for your message – a big time saver.
When you are happy with your design, you can click and download and use the Infographic in presentations, reports and much more.
The Infographic Creator Tool is available to all PRO and MASTER level members with an active membership.
For more details of this useful tool, please visit Infographic Creator Tool.
The take home
Infographics are a great way to get your message across in novel way. Your PMO can show how it’s progressing towards its KPIs, present the headlines of a case study, or demonstrate how one or a group of projects was successful. It can seem a daunting task if you’ve not got design skills within your PMO already. Here, we’ve given you a list of three useful tools for creating infographics for your PMO so you can start communicating more effectively.
