There is typically a lot of time and effort invested to monitor the progress of projects. It is usual that the primary reason for establishing a project management office (PMO) is so as to provide an independent view on project performance. While this is helpful for measuring the success of projects it is also important for a PMO to have a process to measure their own success.
The reason for this is that at some point someone will question what is the value provided by the PMO (especially when there is a downturn in the fortunes of an organisation). Therefore, a smart PMO will implement processes to track and communicate success. This means that they are ready to demonstrate value.
As many of the metrics to demonstrate progress will need to be collected over time, the quicker the PMO starts to collect the data, the better they will be positioned to articulate the value they are adding / creating using facts.
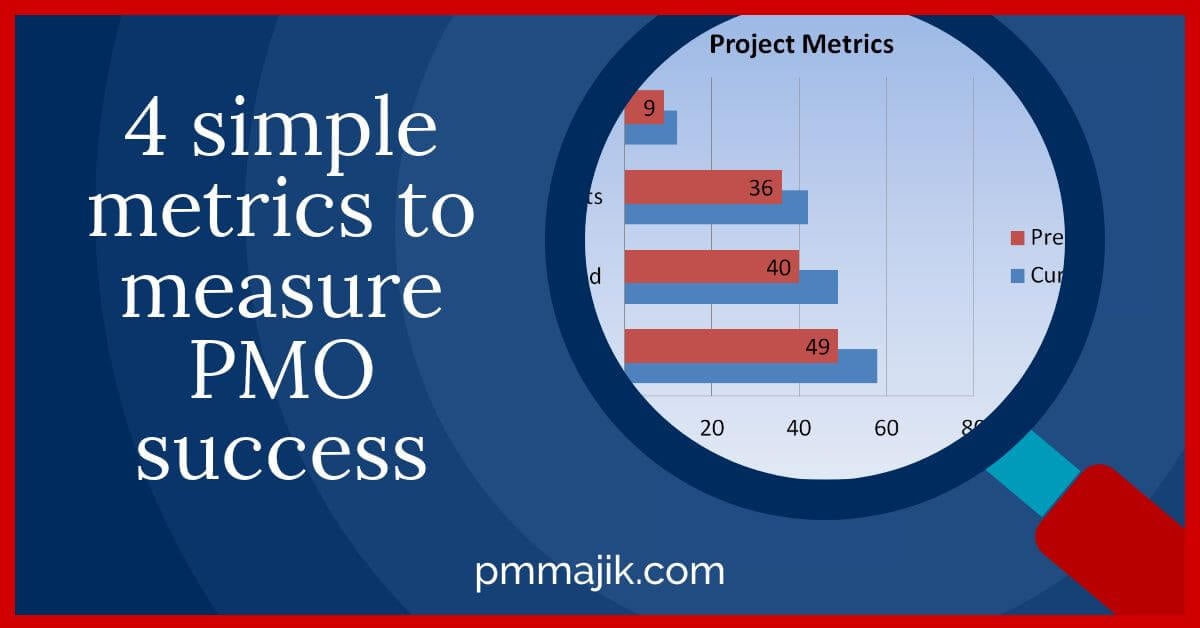
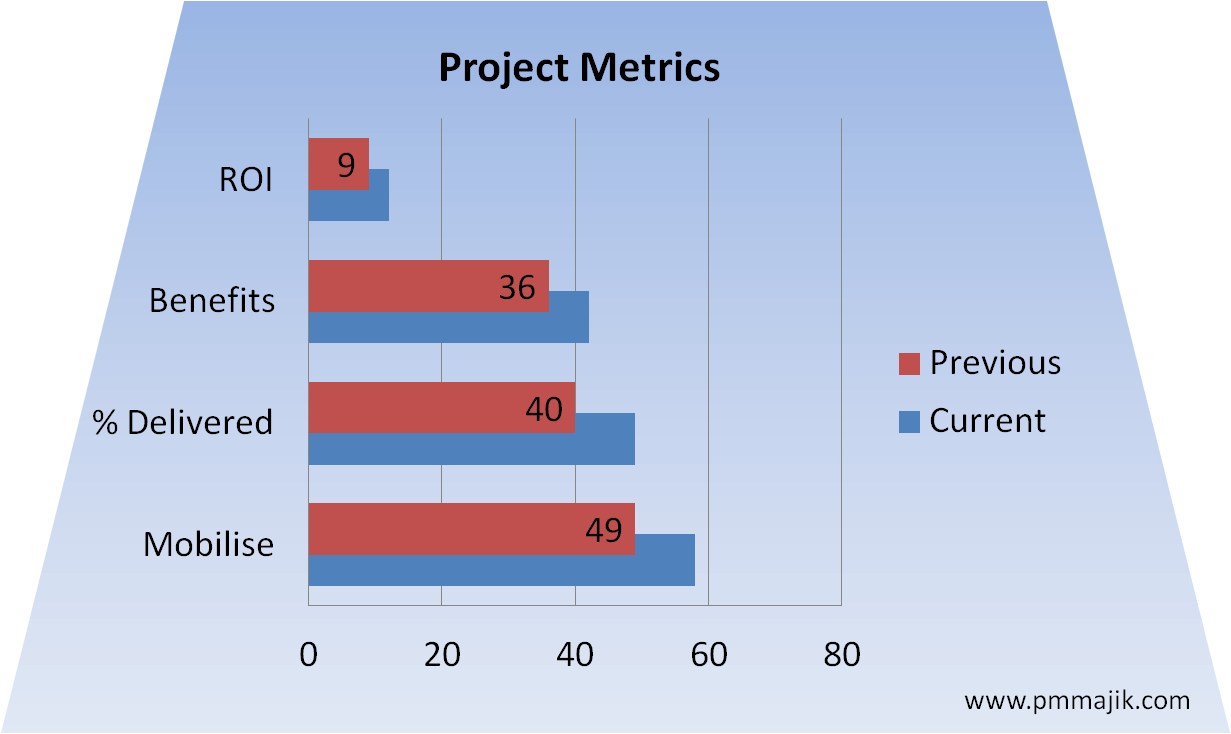
There are a number of metrics that can be utilised, some will be specific to each organisation. Below are 4 ideas of more generic metrics that are very powerful to demonstrate success.
1. Time to Mobilise
A common reason for project failure is slow mobilisation. Tracking the time from project kick-off (the initiation) to mobilisation being complete, will demonstrate that the PMO has improved the time it takes for a project to become productive.
This can be achieved by measuring the time between a project being formerly started to sign-off of the business case (the usual gate into project execution). Obviously you can use the recognised gates used by your organisation.
Over time you will build a bank of metrics that show you how long it typically takes to mobilise. By collecting details of project size and content i.e. IT or even IT, System Name, this information will also help future projects to plan.
For example an IT project can look at previous IT projects for the same system and get an indicator of how long it took to mobilise. This should result in better plans.
2. Percentage of Projects Delivered
This metric will measure how many projects launched (were started) each year (or appropriate time frame) were actually delivered and achieved the benefits in the business case. To track this you will need to be able to build a view of the performance of previous years so as to demonstrate how this has improved.
Variation of this metric is % of projects stopped and % of projects that fail to deliver benefits.
Both are good as it will inform the organisation of their success rate. So if only 60% are delivered, they can factor this into their planning and expectation of the benefits that will be delivered. Far better than assuming and planning for 100% success.
It would then be possible to analyse this data to identify trends / common factors. For example, is it a particular type of project that always fails? Is it a particular team or even project manager / sponsor?
Using other metrics. Is it where a project is slow to mobilise.
All of this should give some good, actionable insights.
3. Benefit Realisation
With the exception of regulatory or mandatory projects, most projects are started in order to achieve some form of benefit for an organisation. Tracking the realisation of benefits against business case will provide focus to ensure that the benefits are achieved. Again the % realised should be measured against previous years.
This is tracked by simply capturing the baseline of benefits against a timescale and then tracking the actuals. This will highlight where the realisation is delayed, reduced or missed.
Similar to Percentage of Projects Delivered, you will be able to analyse to identify the trends and common factors for where benefits are not realised.
4. Return on Investment
Tracking the overall project costs and benefits will allow the calculation of return on investment (ROI) for the portfolio of projects. This is a good metric for senior management as it will provide them with insight on the return from investing in change.
By monitoring year on year, the PMO can show if their service is leading to an increase in project ROI. Again the data can be analysed for trends and this will help corrective actions and / or allow senior management to make more informed decisions i.e. investing in the projects where ROI has historically been higher.
In Summary
A smart PMO will ensure that they have processes in place to track key metrics in order to demonstrate the value that is being added by the PMO through the improvement of project delivery.
Over a period of time the metrics will help identify problem areas i.e. slow mobilisation due to time to gain approval from management, types of projects that fail to deliver, etc. This in turn will allow corrective action.
The data will also help the organisation to make smart informed decisions to best utilise the change budget.
Use the comments below to add your thoughts and experiences of using project metrics.
PMO Metric Resources
If you are interested or looking for a resource to help with defining and tracking PMO and project metrics, you may be interested in the Metrics Framework available within the PM Majik Members Area.