A question often asked is “what value does the PMO add”? While the answer is “lot’s of value” (if the PMO has been set-up correctly), in many cases you need to back this up with some PMO success metrics (aka PMO KPI’s).
What is a PMO KPI?
It is an agreed set of indicators that, if achieved, should demonstrate that the PMO has achieved what is was set-up for. If the correct time and effort has been spent defining a good set of meaningful KPI’s, the PMO should have delivered value. However, if the wrong KPI’s have been chosen, why they may have been achieved, it does not mean value has been delivered.
Example PMO KPI’s
There are many KPI’s that can be chosen to measure the success of a PMO. It is important that they are chosen based on alignment to the objectives and the organisation.
A good place to start would be:
- % of projects delivered
- % of projects delivered inline with business case
- % of projects at Red, Amber, Green status
- % of projects remain at same status for x reporting periods
- % of projects stopped
- % of projects fail to deliver
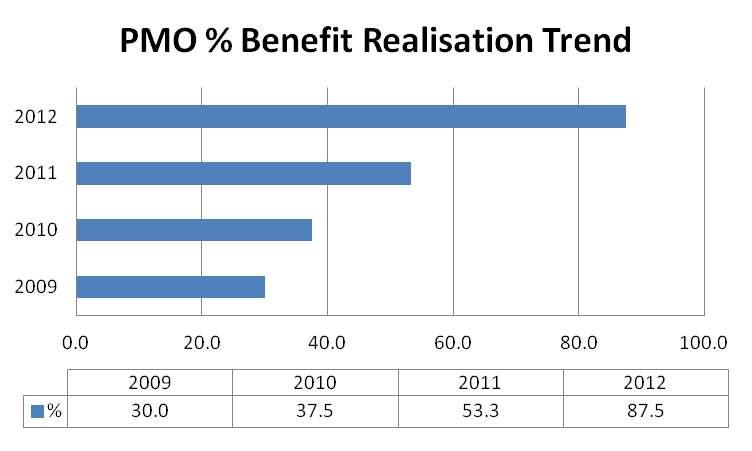
- Benefits realised against Benefit forecast for year
- Simple Return on Investment (ROI) for all of the projects the PMO has oversight for
- Resources added against Resource forecast for year
In order to make this type of KPI’s work is to be able to compare with previous years. This will then allow you to show the positive impact the PMO is having against each of the indicators.
PMO KPI Action Plan
- Spend time to work out what would be the most meaningful indicators for your PMO and / or organisation
- Make sure that you agree the KPI’s with the appropriate stakeholders. This includes agreeing what needs to be evidenced to demonstrate achievement (tip do this at the start when it will be less emotive).
- Work out how the KPI’s will be tracked and put processes in place to collect the data. You may need to go back to capture historic data so as to be able to demonstrate year on year trends.
- Design a dashboard that clearly shows the performance against KPI’s. This will become a very powerful slide in your PMO management report. Take a look at the posts on PMO dashboard design for ideas on designing dashboards.
- Collect and validate the data on a regular basis. Review what the data is telling you and, if performance is not looking as good as previous years, take action early to get back on track.
 Metrics Framework
 If you are looking for a resource that will help you to define and implement metrics and KPI’s in a structured way, you may be interested to find out more about the Metrics Framework. This is an official resource by www.pmmajik.com and is available within the PM Majik Member’s Area.
It includes all the templates, guides and video training to step you through the process and, with instant access, you can start right now!