Communication is vital component of the management of any project. One of the challenges is getting the attention of executive leadership and keeping them updated and informed on the project status.
Introducing the Project Scorecard!
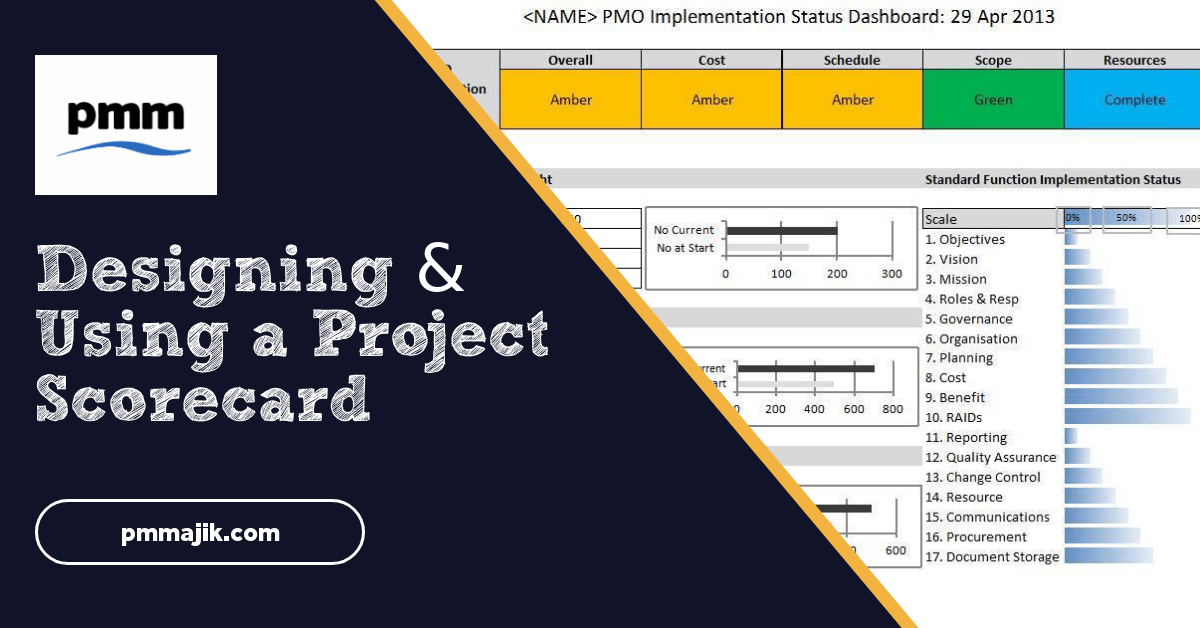
The project scorecard is intended to be a simple visual illustrating the progress and status of a project. It provides a quick “at-a-glance” overview of the project. When you and the team are working hard, you want a scorecard that communicates the progress. When things are falling off the rails, you want your scorecard to ensure the challenges are clear and prompt your stakeholders and leadership to ask questions.
How to Start
The project timeline is the core of any project scorecard. A timeline or Gantt chart shows time verses schedule progress. Every project should have one.
A simple, high-level time is the central component of your project scorecard. You don’t want to show more than ten high-level activities or milestones, remember less is more.
Think visual; and provide a view of the overall timeline, you’re your current place on the timeline in comparison to where the project was scheduled to be at the current date. Your audience should see two things. 1) the major milestones, phases or activities of the project across the timeline, 2) how the project is progressing against the schedule.
Adding More Metrics
In addition to the project timeline – add two or three other project metrics. We’re talking about a budget or a financial metric and a status or risk metric.
Depending on the project other key metrics may help paint the right picture. These metrics will vary greatly and be unique and specific for each project.
Don’t try to show every project metric. Include the relevant metrics and keep it simple. Remember you only get a few minutes of senior management attention – use it wisely.
Here are some key elements to consider for your scorecard.
Open Risks
Risks that have not mitigated or addressed are your open risks. On your scorecard you may choose to highlight the top five open risks or simply show a visual of the number of high, medium and low risks.
Early in the project there are often a large number of high, unmitigated risks. In the early stage, there are many unknowns; like if the project will ever get mobilised. As the project progresses, you can expect to see this number decrease, especially the number of high risks.
Open issues
These are the identified issues and their status. Again, you may choose to show the top five issues or provide a chart showing issue status. As the project moves closer to completion, you will see the open issue to diminish to zero.
Budget
For each project the level of detail you represent in your budget chart will be very different. Ideally, this chart will illustrate the budget status, are you on plan? A simple planned verses actual bar chart can be effective.
Open Tasks or Action Items
Depending on the audience; you may choose to include the most pressing tasks or a simple pie chart that details the number of tasks that are on schedule and number of overdue tasks. The number and status of the open tasks or action items is a good indicator of the work load. Lots of tasks; something is happening – this is your back log. Too many overdue tasks says you’re not keeping pace with your plan.
Select the metrics suited to your project. Ideally your project scorecard will fit on one page or one slide. Remember executive audiences do not need to know everything – they need enough information to determine if they need to dig in further. Keep it simple and succinct.
Consider your Delivery and Format
The format must be clean and consistent. Avoid pictures and visuals that add no value. Avoid complicated charts or lists – if the chart needs an explanation it is too complicated.
Each element should be simple and easily understood. The layout should remain consistent. Don’t change the order of the charts on the page, stick with the same color scheme and chart types. Staying consistent will allow your audience to quickly scan the scorecard for the key information, see changes or red-flags quickly.
How your scorecard is delivered is also important. Obviously, posting the scorecard on the wall in your project area won’t get the appropriate attention. Or expecting executives to log into a project management system to see the scorecard is not reasonable.
Sharing the scorecard during update meetings and following up by emailing the scorecard is a common approach. Consider putting a few hot topic items directly in the body of email. Many executives may not have the time to open email attachments – putting teaser data in the email can prompt opening the email attachment.
Using a Project Scorecard
How often you update and distribute the scorecard will depend on the complexity of the project and duration. For a 12-month project, monthly might be sufficient. However, if the project is complex or just a few weeks, you may want to update and distribute the scorecard each week.
Share the scorecard with your project team and customers as well as your project sponsors and stakeholders. A good scorecard will give everyone; including the project manager, risk indicators. The simple act of updating the scorecard is a way of taking the project’s temperature.
Keep your project healthy, create a simple project scorecard that is consistent in schedule, format and easily accessible.
You might want to check the post, Simple PMO Dashboard, for some more ideas.