Continuing with the problem-solving theme from our last article, Root Cause Analysis Tools: The 5 Why’s, here I look at a tool which is more suitable for larger, more complex problems.
What is Cause and Effect Analysis?
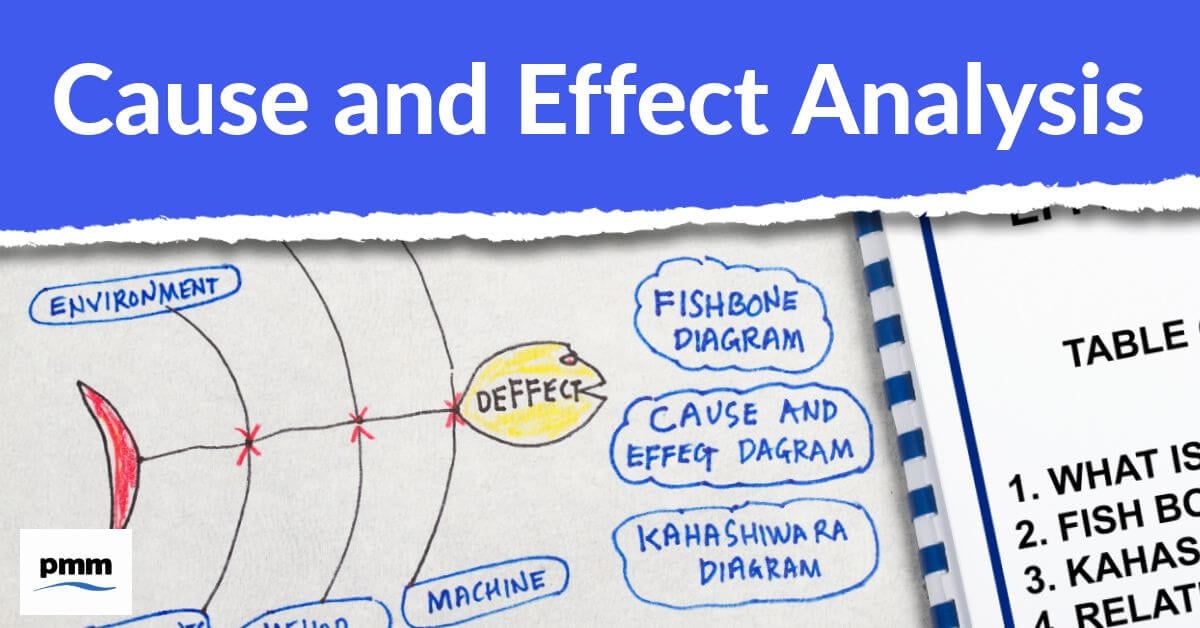
Sometimes referred to as the Fishbone Diagram, Cause and Effect Analysis was developed by quality management pioneer, Professor Kaoru Ishikawa in the 1960s. Its alternative name derives from the fishbone shape that the analysis takes.
Traditionally, it was used for quality improvement purposes, however it is now commonly used to analyse business processes, identifying causes, hindrances and ways in which it can be improved.
Why use Cause and Effect Analysis?
Many people look at problems as instances of failure or setbacks, rather than an opportunity for growth and improvement.
Effective problem-solving will ensure that opportunities to improve are grasped, whilst the occurrence of undesirable issues will be solved.
To prevent occurring issues, the business situation should be analysed thoroughly with root causes analysed and solutions provided.
How is it used?
The analysis is a two-step process involving looking backwards to analyse what went wrong, followed by planning for the future.
Looking backward
Areas in which mistakes were made are identified and time is analysing the causes of those mistakes.
Once problematic areas have been identified, the appropriate measures can be taken to ensure that the mistakes do not re-occur. Similarly, if an area of the process has worked really well then this can be replicated going forward.
Looking to the future
Looking forward, future problems and their solutions are anticipated. This enables the team to plan for them well in advance.
Forward planning also enables the team to build on their success, determining which direction the business will take based on the steps taken in the present.
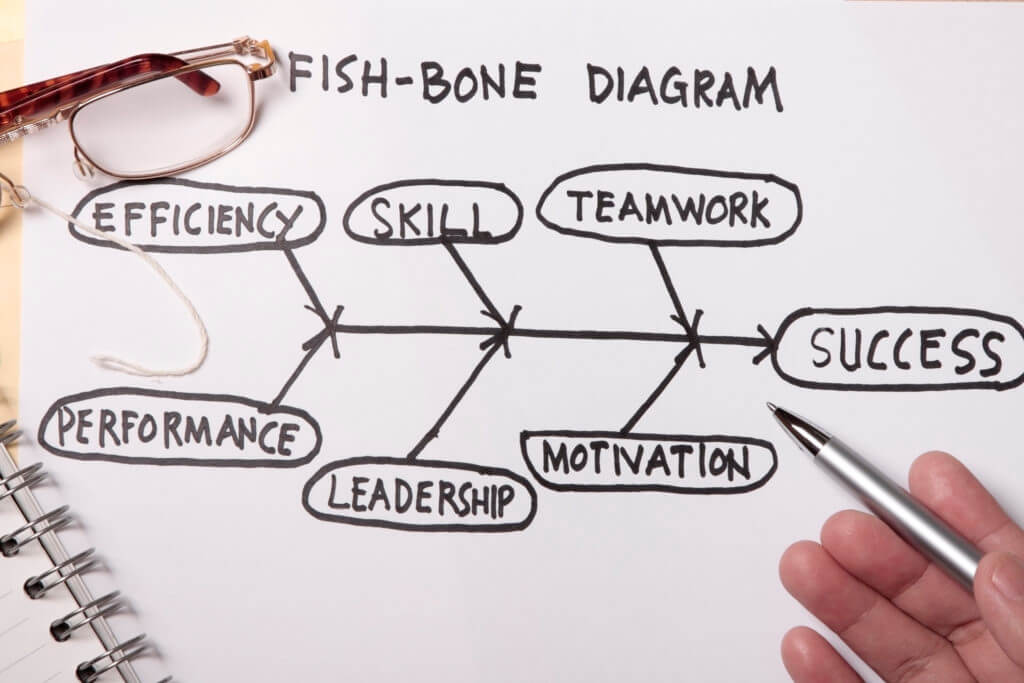
The Fishbone Diagram
The fishbone diagram is useful brainstorming tool and is commonly used in cause and effect analysis.
It provides a visual representation of the causes and their effect on the business in a structured format.
Its name stems from the shape that it takes. The fish “head” details the actual mistake to be discussed. Smaller “bones” then identify possible cause that contributed to the mistake. Causes are grouped into four main categories but may be sub-divided further depending on the size of the problem.
Some organisations may choose to customise the diagram to their business by using different categories which meet their needs and objectives.
People
Causes related to humans fall into the people category. Here it should be determined whether there is effective communication amongst the project team, and that each individual understands their task. It is also vital to recognise whether individuals have sufficient involvement, experience and training.
Machines
Issues that have been caused by machinery, computers, tools and installations are considered in this category. There can be some overlap with people in this category if they are responsible for the operation and selection of the appropriate machinery.
The safety and installation of the machines should be considered, alongside their reliability and ability to perform the task.
Material
The materials used to develop products can have a significant effect on the finished article, both in a positive and negative way.
Identify whether the materials are of a reasonable quality and if this contributed to the failure of the product. Determine also, whether issues occurred with consumables and semi-finished products.
Methods
This category identifies if work methods and processes were responsible for the problem. Ascertain how individuals and departments communicated with one another throughout the process, and whether the methods employed were adequate enough to carry out the task.
The Cause and Effect process
The process takes four steps:
1. Identify the problem
Firstly, the problem should be clearly identified and addressed in order to find appropriate solutions. The problem makes up the head of the fishbone diagram.
2. Identify main causes
After identifying the problem, the main causes can be determined. If the standard fishbone diagram is being used then the main causes will be people, machines, material and methods.
Draw a line from the main body of the fishbone for each of the four categories.
3. Investigate causes
Now, the investigation of causes can begin. Business processes should be explored thoroughly, and all equipment tested for faults.
Use a line to connect each cause to the relevant category.
4. Analysis
Now that all of the causes have been identified and categorised the diagram is complete, and the analysis can begin. To create a more effective analysis, each problem should be further categorised by the level of influence that it has on the problem or it’s priority.
After the analysis has taken place, an action plan can be formulated with clear goals, objectives and priorities. The plan should explain in detail how the problems will be solved permanently and should be implemented immediately.
Cause and Effect Analysis is an easily understood tool that is easy to implement. It’s ability to solve both simple and complex problems make it a versatile tool that can be used in many different workplaces.